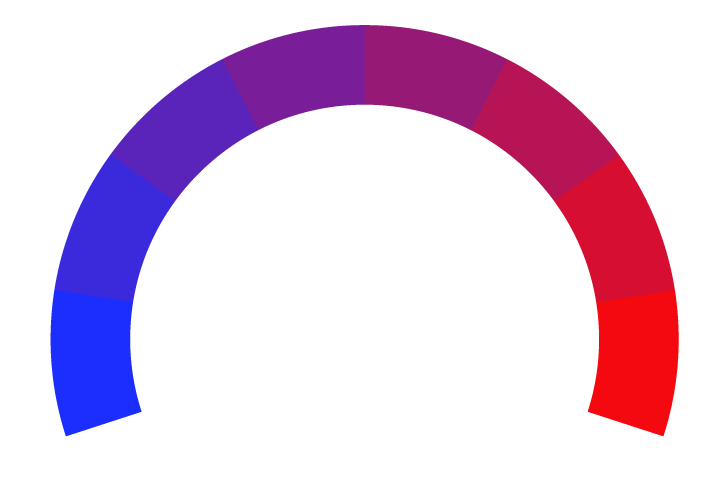
 The Daily Caller Article Rating
ALREDO ORTIZ: How Trump Won The Hispanic Vote
- Bias Rating
16% Somewhat Conservative
- Reliability
75% ReliableGood
- Policy Leaning
26% Somewhat Conservative
- Politician Portrayal
-29% Negative
Continue For Free
Create your free account to see the in-depth bias analytics and more.
Continue
Continue
By creating an account, you agree to our Terms and Privacy Policy, and subscribe to email updates. Already a member: Log inBias Score Analysis
The A.I. bias rating includes policy and politician portrayal leanings based on the author’s tone found in the article using machine learning. Bias scores are on a scale of -100% to 100% with higher negative scores being more liberal and higher positive scores being more conservative, and 0% being neutral.
Sentiments
6% Positive
- Liberal
- Conservative
| Sentence | Sentiment | Bias |
|---|---|---|
Unlock this feature by upgrading to the Pro plan. | ||
Reliability Score Analysis
Policy Leaning Analysis
Politician Portrayal Analysis
Bias Meter
Extremely
Liberal
Very
Liberal
Moderately
Liberal
Somewhat Liberal
Center
Somewhat Conservative
Moderately
Conservative
Very
Conservative
Extremely
Conservative
-100%
Liberal
100%
Conservative

Contributing sentiments towards policy:
62% : They merely needed to observe and compare their quality of life while Trump and Harris were in office.46% : Trump spoke to these concerns far better than Democrats, and that is the reason for his historic performance with Hispanics.
46% : Real median Hispanic household income grew more between 2017 and 2019 under Trump, than between 2021 and 2023 under Biden-Harris.
41% : The Harris campaign ran on this soft bigotry through promises such as forgivable $20,000 loans to Hispanic men, but Trump treated Hispanics as part of his broader coalition of working-class Americans striving for the American Dream.
30% : Trump recognized that Hispanics are not an identity group that can be pitted against others in tribal political warfare.
*Our bias meter rating uses data science including sentiment analysis, machine learning and our proprietary algorithm for determining biases in news articles. Bias scores are on a scale of -100% to 100% with higher negative scores being more liberal and higher positive scores being more conservative, and 0% being neutral. The rating is an independent analysis and is not affiliated nor sponsored by the news source or any other organization.


