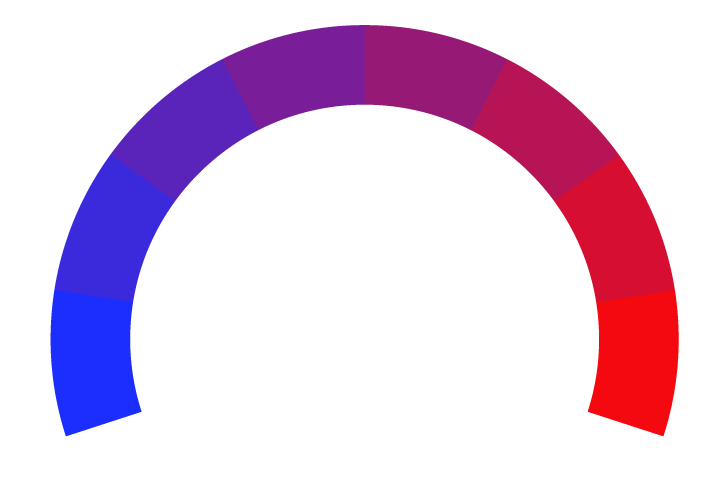
 Eagle-Tribune Article Rating
'100% about race': Trial begins on legislative maps' impact on Black Detroit voters
- Bias Rating
8% Center
- Reliability
70% ReliableGood
- Policy Leaning
N/A
- Politician Portrayal
-56% Negative
Continue For Free
Create your free account to see the in-depth bias analytics and more.
Continue
Continue
By creating an account, you agree to our Terms and Privacy Policy, and subscribe to email updates. Already a member: Log inBias Score Analysis
The A.I. bias rating includes policy and politician portrayal leanings based on the author’s tone found in the article using machine learning. Bias scores are on a scale of -100% to 100% with higher negative scores being more liberal and higher positive scores being more conservative, and 0% being neutral.
Sentiments
N/A
- Liberal
- Conservative
| Sentence | Sentiment | Bias |
|---|---|---|
Unlock this feature by upgrading to the Pro plan. | ||
Reliability Score Analysis
Policy Leaning Analysis
Politician Portrayal Analysis
Bias Meter
Extremely
Liberal
Very
Liberal
Moderately
Liberal
Somewhat Liberal
Center
Somewhat Conservative
Moderately
Conservative
Very
Conservative
Extremely
Conservative
-100%
Liberal
100%
Conservative

Contributing sentiments towards policy:
52% : The commission was required under state and federal law to balance several factors in drawing the maps, such as equal population distribution, contiguous districts, and compliance with the Voting Rights Act, which protects a variety of voting rights including protections against discriminatory gerrymandering.47% : The suit was filed against Secretary of State Jocelyn Benson and the 13 members of the Michigan Independent Citizens Redistricting Commission who drew the maps.
45% : Commissioners relied heavily on voting rights experts and consultants who told them that, under federal law, Metro Detroit districts could be drawn without having a majority of Black Detroiters in the districts.
*Our bias meter rating uses data science including sentiment analysis, machine learning and our proprietary algorithm for determining biases in news articles. Bias scores are on a scale of -100% to 100% with higher negative scores being more liberal and higher positive scores being more conservative, and 0% being neutral. The rating is an independent analysis and is not affiliated nor sponsored by the news source or any other organization.


