 New York Post Article Rating
Here's the key to reading the tight polls and predicting a Trump win
- Bias Rating
18% Somewhat Conservative
- Reliability
55% ReliableAverage
- Policy Leaning
22% Somewhat Conservative
- Politician Portrayal
N/A
Continue For Free
Create your free account to see the in-depth bias analytics and more.
Continue
Continue
By creating an account, you agree to our Terms and Privacy Policy, and subscribe to email updates. Already a member: Log inBias Score Analysis
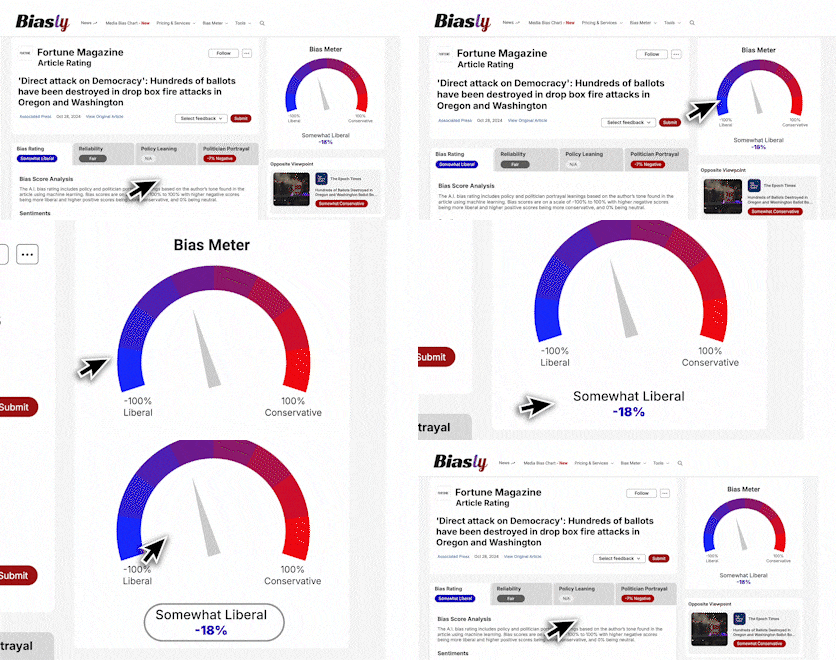
The A.I. bias rating includes policy and politician portrayal leanings based on the author’s tone found in the article using machine learning. Bias scores are on a scale of -100% to 100% with higher negative scores being more liberal and higher positive scores being more conservative, and 0% being neutral.
Sentiments
16% Positive
- Liberal
- Conservative
| Sentence | Sentiment | Bias |
|---|---|---|
Unlock this feature by upgrading to the Pro plan. | ||
Reliability Score Analysis
Policy Leaning Analysis
Politician Portrayal Analysis
Bias Meter
Extremely
Liberal
Very
Liberal
Moderately
Liberal
Somewhat Liberal
Center
Somewhat Conservative
Moderately
Conservative
Very
Conservative
Extremely
Conservative
-100%
Liberal
100%
Conservative

Contributing sentiments towards policy:
68% : Nationally this trade is good for Trump, as he's gaining more among the nonwhites who will be 22% to 25% of the electorate than he's losing among the college-educated whites who'll be a tad more than 30%.61% : If you compare these margins with my predicted 1.3-point Harris win, Trump carries every one.
60% : An Atlas Intel poll shows Trump up by 2 points.
57% : And an R+2 electorate gives Trump the popular-vote victory by a 0.46-point margin.
53% : Morning Consult has Trump up by 86 with Republicans, while Atlas had him up by 84.
46% : That's what a number of polls suggest, showing Trump leading among all registered voters but trailing among so-called likely voters.
45% : Noted political analyst Nate Silver's model says no; it shows Trump with a 53.8% chance to win the Electoral College with a predicted 2.1-point Harris national-popular-vote margin.
43% : The result is Harris led with Democrats by 89 points (94% to 5%) while Trump led with Republicans by 87 (93-6).
43% : The data are clear: Trump is gaining votes relative to 2020 with blacks and Hispanics while he's losing them among whites with a college degree.
41% : She wins independents by 5 or 6 points in three of the polls I consulted, but she also loses independents to Trump in three other polls.
40% : And it's clear the cumulative weight of the evidence on hand today suggests Trump has the better chance of prevailing than does Harris.
30% : This means Trump will likely have more "wasted votes" -- votes that do not affect whether he wins a state -- than he previously did.
*Our bias meter rating uses data science including sentiment analysis, machine learning and our proprietary algorithm for determining biases in news articles. Bias scores are on a scale of -100% to 100% with higher negative scores being more liberal and higher positive scores being more conservative, and 0% being neutral. The rating is an independent analysis and is not affiliated nor sponsored by the news source or any other organization.


