How Donald Trump won the presidency
- Bias Rating
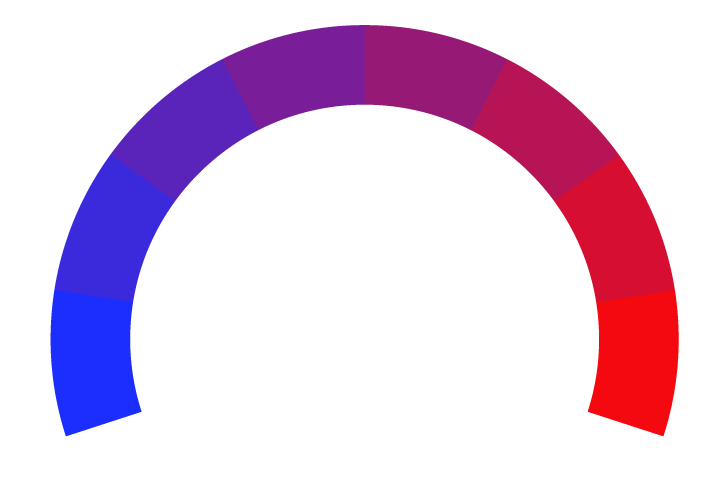
24% Somewhat Conservative
- Reliability
45% ReliableFair
- Policy Leaning
-2% Center
- Politician Portrayal
20% Positive
Continue For Free
Create your free account to see the in-depth bias analytics and more.
Continue
Continue
By creating an account, you agree to our Terms and Privacy Policy, and subscribe to email updates. Already a member: Log inBias Score Analysis
The A.I. bias rating includes policy and politician portrayal leanings based on the author’s tone found in the article using machine learning. Bias scores are on a scale of -100% to 100% with higher negative scores being more liberal and higher positive scores being more conservative, and 0% being neutral.
Sentiments
33% Positive
- Liberal
- Conservative
| Sentence | Sentiment | Bias |
|---|---|---|
Unlock this feature by upgrading to the Pro plan. | ||
Reliability Score Analysis
Policy Leaning Analysis
Politician Portrayal Analysis
Bias Meter
Extremely
Liberal
Very
Liberal
Moderately
Liberal
Somewhat Liberal
Center
Somewhat Conservative
Moderately
Conservative
Very
Conservative
Extremely
Conservative
-100%
Liberal
100%
Conservative

Contributing sentiments towards policy:
68% : Latino men moved 33 points toward Trump, one of his biggest swings.53% : Over the next few months, we at 538 will do a lot of analysis to figure out how exactly Trump won.
52% : For all the hubbub about various issues, statements, rallies and rhetoric during this election, the economy is unique as providing the most obvious gravitational pull toward Trump.
52% : Over the next few months, we'll be able to pore over even more data about why Trump won (again).
50% : Among these voters, Trump led 79 percent to 20 percent.
49% : Non-white non-college-educated voters, meanwhile, moved 13 points toward Trump.
48% : The exit poll indicates Trump won white voters by 12 percentage points, 55 percent to Harris's 43 percent.
47% : Plus, while it will take some time to count all the ballots, Trump looks likely to win the national popular vote for president, too.
46% : As of 6 a.m. Eastern, Georgia, North Carolina, Pennsylvania and Wisconsin had been projected for Trump, and the once-and-future president leads in Arizona, Michigan and Nevada as well.
45% : Eighty-one percent of these people voted for Harris and just 17 percent for Trump.
39% : It is not a stretch of the imagination to imagine they would punish the incumbent party for this regardless of how unfavorably they viewed Trump; in fact that is what voters have been doing all around the world over the past three years.
*Our bias meter rating uses data science including sentiment analysis, machine learning and our proprietary algorithm for determining biases in news articles. Bias scores are on a scale of -100% to 100% with higher negative scores being more liberal and higher positive scores being more conservative, and 0% being neutral. The rating is an independent analysis and is not affiliated nor sponsored by the news source or any other organization.


 ABC News