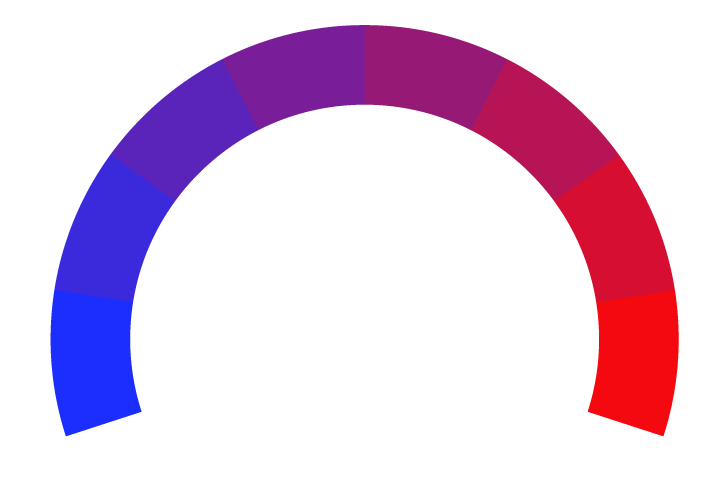
 Sports Illustrated Article Rating
Points of Emphasis: Louisville vs. Georgia Tech
- Bias Rating
Center
- Reliability
40% ReliableAverage
- Policy Leaning
N/A
- Politician Portrayal
N/A
Continue For Free
Create your free account to see the in-depth bias analytics and more.
Continue
Continue
By creating an account, you agree to our Terms and Privacy Policy, and subscribe to email updates. Already a member: Log inBias Score Analysis
The A.I. bias rating includes policy and politician portrayal leanings based on the author’s tone found in the article using machine learning. Bias scores are on a scale of -100% to 100% with higher negative scores being more liberal and higher positive scores being more conservative, and 0% being neutral.
Sentiments
N/A
- Liberal
- Conservative
| Sentence | Sentiment | Bias |
|---|---|---|
Unlock this feature by upgrading to the Pro plan. | ||
Reliability Score Analysis
Policy Leaning Analysis
Politician Portrayal Analysis
Bias Meter
Extremely
Liberal
Very
Liberal
Moderately
Liberal
Somewhat Liberal
Center
Somewhat Conservative
Moderately
Conservative
Very
Conservative
Extremely
Conservative
-100%
Liberal
100%
Conservative

Contributing sentiments towards policy:
62% : GT gave up 437.1 yards and 29.5 points per game, placing at No. 120 and No. 94 in the FBS.47% : So far, Georgia Tech is putting up 424.6 yards and 31.1 points per game, which comes out to be No. 34 and No. 42 in the nation, respectively. A lot of this has been powered by dual threat quarterback Haynes King, who has taken a step forward from last season.
42% : Watson is No. 3 at 13.7 while Brown is No. 5 at 12.77.
*Our bias meter rating uses data science including sentiment analysis, machine learning and our proprietary algorithm for determining biases in news articles. Bias scores are on a scale of -100% to 100% with higher negative scores being more liberal and higher positive scores being more conservative, and 0% being neutral. The rating is an independent analysis and is not affiliated nor sponsored by the news source or any other organization.


