 The Philadelphia Inquirer Article Rating
Trump's campaign to win over Black Philadelphians had some success. Black voters told us why.
- Bias Rating
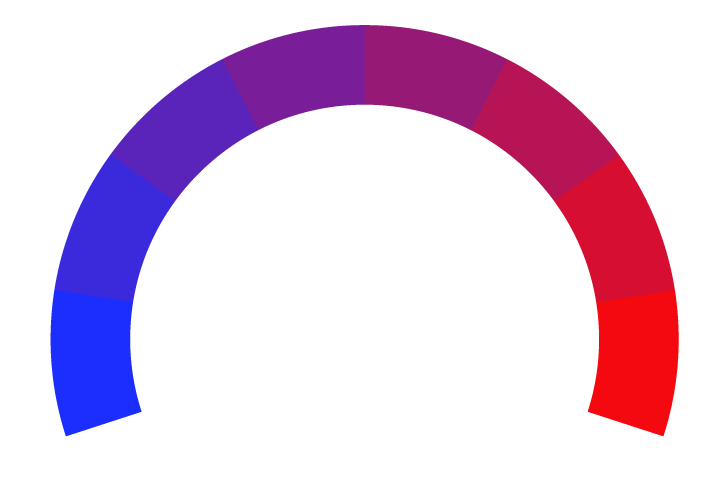
10% Center
- Reliability
65% ReliableAverage
- Policy Leaning
10% Center
- Politician Portrayal
-28% Negative
Continue For Free
Create your free account to see the in-depth bias analytics and more.
Continue
Continue
By creating an account, you agree to our Terms and Privacy Policy, and subscribe to email updates. Already a member: Log inBias Score Analysis
The A.I. bias rating includes policy and politician portrayal leanings based on the author’s tone found in the article using machine learning. Bias scores are on a scale of -100% to 100% with higher negative scores being more liberal and higher positive scores being more conservative, and 0% being neutral.
Sentiments
25% Positive
- Liberal
- Conservative
| Sentence | Sentiment | Bias |
|---|---|---|
Unlock this feature by upgrading to the Pro plan. | ||
Reliability Score Analysis
Policy Leaning Analysis
Politician Portrayal Analysis
Bias Meter
Extremely
Liberal
Very
Liberal
Moderately
Liberal
Somewhat Liberal
Center
Somewhat Conservative
Moderately
Conservative
Very
Conservative
Extremely
Conservative
-100%
Liberal
100%
Conservative

Contributing sentiments towards policy:
64% : Citywide, Trump enjoyed increased support across racial lines in less affluent neighborhoods with fewer college graduates.62% : Neither Jones nor Brown was surprised Trump won.
59% : It's also a staggering leap in support for the president-elect compared with 2020, when exit polling found Trump garnered support from just 10% of Black men in Pennsylvania.
50% : And marginal growth in support for Trump in some majority-Black precincts, coupled with lower-than-expected turnout, helped him perform better in Black precincts.
48% : But: "If I would have voted," she said, "I probably would have voted for Trump."
46% : " Gamble also said anxieties about the economy and immigration helped Trump.
38% : Jones cited social issues, like disapproval of unisex bathrooms, as a "good point" for Trump.
37% : In Pennsylvania however, 26% of Black men, more than a quarter, voted for Trump according to exit polling that surveys voters as they're leaving the polls.
33% : They also pointed to concerns about transgender rights and Harris' racial identity -- two social issues over which the Republican Party attacked Harris -- which they said kept them from voting Democrat or engendered them to Trump.
31% : Black men who voted for Trump locally offered a number of reasons they believe he grew his vote share in the city, from perceptions of an ineffective Democratic Party to inflation to immigration.
29% : In three of the top five mostly Black precincts where turnout fell, Trump increased his share of votes without actually garnering more votes himself.
29% : She questioned Harris' race, a point that was introduced by Trump and parroted by conservatives to discredit Harris among Black voters.
29% : "She kind of got thrown into the race by default when Biden got sick," said Waters, 30, of Harris' candidacy, "and Trump's been around for quite a long time.
28% : Democrats performed worse in 649 of the 688 majority-Black precincts in Philadelphia while Trump grew his share of votes in 635 majority-Black precincts as compared to 2020.
28% : Shawn Gamble Jr. said sociocultural issues could have influenced more Black men to cast a ballot for Trump or influenced Black voters to sit out the election in general.
23% : Gamble, who voted for Trump and is an officer with the Black Conservative Federation, said a family member who did not vote at all flagged a conservative ad bashing Harris' support for transgender individuals.
21% : According to an Inquirer analysis of election results, Democrats performed worse in 649 of the 688 majority-Black precincts in Philadelphia while Trump grew his share of votes in 635 majority-Black precincts as compared with 2020.
*Our bias meter rating uses data science including sentiment analysis, machine learning and our proprietary algorithm for determining biases in news articles. Bias scores are on a scale of -100% to 100% with higher negative scores being more liberal and higher positive scores being more conservative, and 0% being neutral. The rating is an independent analysis and is not affiliated nor sponsored by the news source or any other organization.


