Ohio voucher program: Data shows nearly 90% of participants are not low-income
- Bias Rating
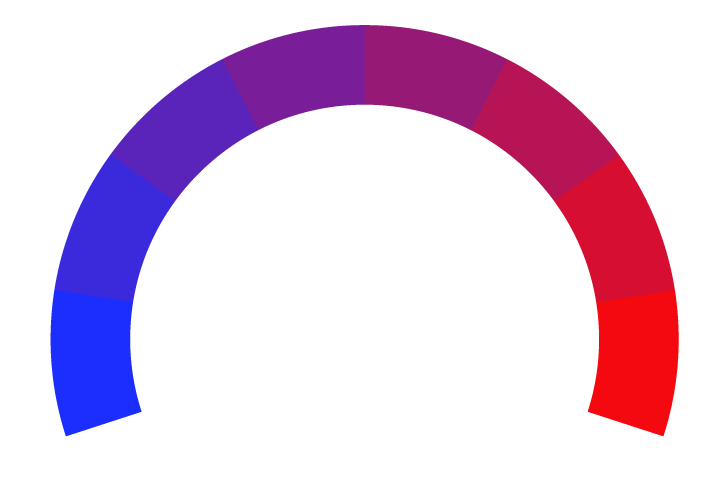
6% Center
- Reliability
55% ReliableAverage
- Policy Leaning
6% Center
- Politician Portrayal
N/A
Continue For Free
Create your free account to see the in-depth bias analytics and more.
Continue
Continue
By creating an account, you agree to our Terms and Privacy Policy, and subscribe to email updates. Already a member: Log inBias Score Analysis
The A.I. bias rating includes policy and politician portrayal leanings based on the author’s tone found in the article using machine learning. Bias scores are on a scale of -100% to 100% with higher negative scores being more liberal and higher positive scores being more conservative, and 0% being neutral.
Sentiments
1% Positive
- Liberal
- Conservative
| Sentence | Sentiment | Bias |
|---|---|---|
Unlock this feature by upgrading to the Pro plan. | ||
Reliability Score Analysis
Policy Leaning Analysis
Politician Portrayal Analysis
Bias Meter
Extremely
Liberal
Very
Liberal
Moderately
Liberal
Somewhat Liberal
Center
Somewhat Conservative
Moderately
Conservative
Very
Conservative
Extremely
Conservative
-100%
Liberal
100%
Conservative

Contributing sentiments towards policy:
56% : Ohio's K-12 voucher program has made headlines recently as lawmakers consider trimming millions in state funds for public schools while expanding funds for state vouchers.56% : Further, according to a report from the General Assembly, 17% of EdChoice-Exp scholarships go to the state's top earners, all making more than $200,000 per year.
53% : That means fully and fairly funding public schools rather than handing out vouchers to private or unregulated charter schools," State Rep. Anita Somani (D-Dublin) said.
35% : Many Democratic lawmakers, public school advocates and teachers' unions point to state data like this to say vouchers no longer help low-income students and instead defer money from public schools.
*Our bias meter rating uses data science including sentiment analysis, machine learning and our proprietary algorithm for determining biases in news articles. Bias scores are on a scale of -100% to 100% with higher negative scores being more liberal and higher positive scores being more conservative, and 0% being neutral. The rating is an independent analysis and is not affiliated nor sponsored by the news source or any other organization.


