Proppants Market Projected to Reach USD 20.10 Billion by 2032 | Rising Hydraulic Fracturing Activities Driving Market Growth | Business Upturn
- Bias Rating
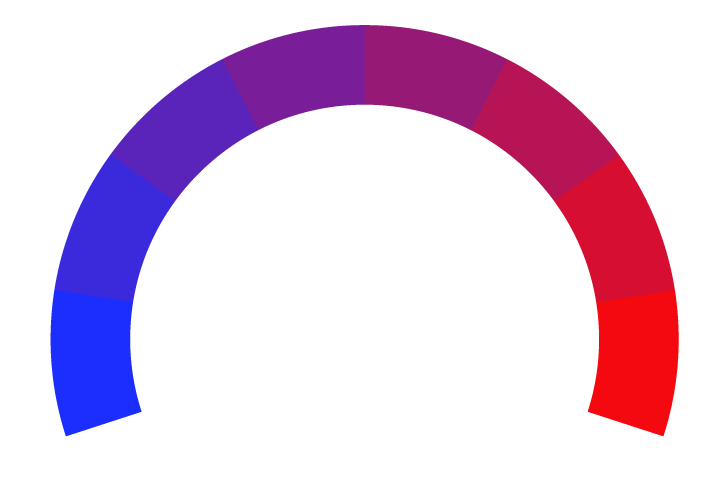
56% Medium Conservative
- Reliability
N/AN/A
- Policy Leaning
56% Medium Conservative
- Politician Portrayal
N/A
Continue For Free
Create your free account to see the in-depth bias analytics and more.
Continue
Continue
By creating an account, you agree to our Terms and Privacy Policy, and subscribe to email updates. Already a member: Log inBias Score Analysis
The A.I. bias rating includes policy and politician portrayal leanings based on the author’s tone found in the article using machine learning. Bias scores are on a scale of -100% to 100% with higher negative scores being more liberal and higher positive scores being more conservative, and 0% being neutral.
Sentiments
51% Positive
- Conservative
| Sentence | Sentiment | Bias |
|---|---|---|
Unlock this feature by upgrading to the Pro plan. | ||
Reliability Score Analysis
Policy Leaning Analysis
Politician Portrayal Analysis
Bias Meter
Extremely
Liberal
Very
Liberal
Moderately
Liberal
Somewhat Liberal
Center
Somewhat Conservative
Moderately
Conservative
Very
Conservative
Extremely
Conservative
-100%
Liberal
100%
Conservative

Contributing sentiments towards policy:
65% : Driven by increasing shale gas exploration, growing investments in energy infrastructure, and the widespread application of proppants in unconventional oil & gas production, proppants consumption is rising globally.46% : In the United States, which accounted for a major share of the global proppants market in 2023, the surge in shale gas and tight oil production continues to fuel demand The Permian Basin, Eagle Ford, and Bakken formations remain key regions for proppant consumption, supported by favorable government policies, tax incentives, and increased well completions.
39% : Positive government policies, technology advances, and energy security programs have also stimulated ongoing exploration and production activities.
*Our bias meter rating uses data science including sentiment analysis, machine learning and our proprietary algorithm for determining biases in news articles. Bias scores are on a scale of -100% to 100% with higher negative scores being more liberal and higher positive scores being more conservative, and 0% being neutral. The rating is an independent analysis and is not affiliated nor sponsored by the news source or any other organization.


