Steve Kornacki: How Democratic voter intensity powered Susan Crawford to a win in Wisconsin
- Bias Rating
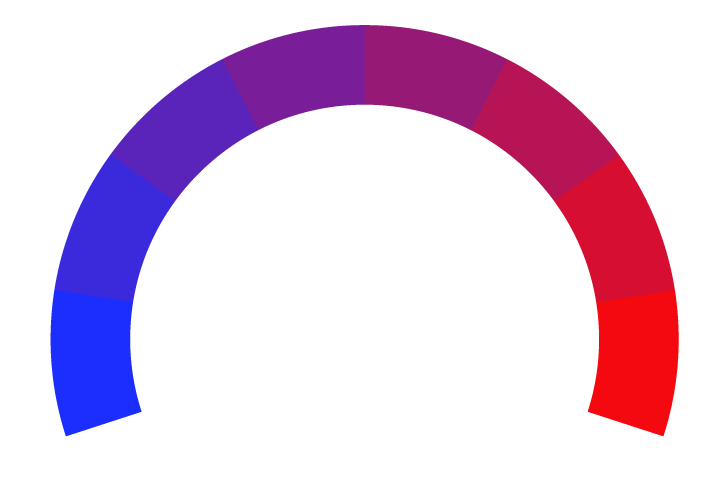
-18% Somewhat Liberal
- Reliability
30% ReliableAverage
- Policy Leaning
-16% Somewhat Liberal
- Politician Portrayal
-28% Negative
Continue For Free
Create your free account to see the in-depth bias analytics and more.
Continue
Continue
By creating an account, you agree to our Terms and Privacy Policy, and subscribe to email updates. Already a member: Log inBias Score Analysis
The A.I. bias rating includes policy and politician portrayal leanings based on the author’s tone found in the article using machine learning. Bias scores are on a scale of -100% to 100% with higher negative scores being more liberal and higher positive scores being more conservative, and 0% being neutral.
Sentiments
25% Positive
- Liberal
- Conservative
| Sentence | Sentiment | Bias |
|---|---|---|
Unlock this feature by upgrading to the Pro plan. | ||
Reliability Score Analysis
Policy Leaning Analysis
Politician Portrayal Analysis
Bias Meter
Extremely
Liberal
Very
Liberal
Moderately
Liberal
Somewhat Liberal
Center
Somewhat Conservative
Moderately
Conservative
Very
Conservative
Extremely
Conservative
-100%
Liberal
100%
Conservative

Contributing sentiments towards policy:
80% : Trump held Harris to a 44-point margin in Milwaukee's majority Hispanic precincts last year, an impressive achievement for a Republican compared to the past.54% : Trump drew overwhelming support from white voters without college degrees who are found primarily in exurban, small-town and rural Wisconsin.
54% : It was here in particular that Trump struck gold with blue-collar white voters when he first ran in 2016, and in 2024 he carried the area again by double digits.
45% : The political base that powered Trump to victory in the Badger State couldn't be more demographically opposite.
42% : In 2024, Trump also folded in new support from nonwhite voters, many of them younger, male and first-time participants, who are more clustered in and around Milwaukee.
*Our bias meter rating uses data science including sentiment analysis, machine learning and our proprietary algorithm for determining biases in news articles. Bias scores are on a scale of -100% to 100% with higher negative scores being more liberal and higher positive scores being more conservative, and 0% being neutral. The rating is an independent analysis and is not affiliated nor sponsored by the news source or any other organization.


 NBC News