These 2024 Election Stats Absolutely Stunned Liberal Data Analysts
- Bias Rating
44% Medium Conservative
- Reliability
60% ReliableAverage
- Policy Leaning
82% Very Conservative
- Politician Portrayal
-24% Negative
Continue For Free
Create your free account to see the in-depth bias analytics and more.
Continue
Continue
By creating an account, you agree to our Terms and Privacy Policy, and subscribe to email updates. Already a member: Log inBias Score Analysis
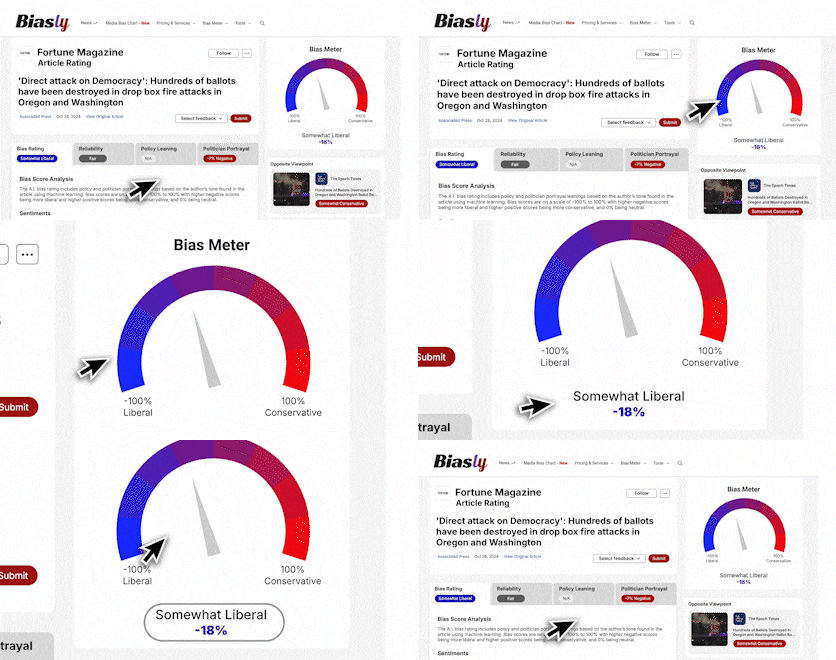
The A.I. bias rating includes policy and politician portrayal leanings based on the author’s tone found in the article using machine learning. Bias scores are on a scale of -100% to 100% with higher negative scores being more liberal and higher positive scores being more conservative, and 0% being neutral.
Sentiments
11% Positive
- Liberal
- Conservative
| Sentence | Sentiment | Bias |
|---|---|---|
Unlock this feature by upgrading to the Pro plan. | ||
Reliability Score Analysis
Policy Leaning Analysis
Politician Portrayal Analysis
Bias Meter
Extremely
Liberal
Very
Liberal
Moderately
Liberal
Somewhat Liberal
Center
Somewhat Conservative
Moderately
Conservative
Very
Conservative
Extremely
Conservative
-100%
Liberal
100%
Conservative

Contributing sentiments towards policy:
70% : But if you look at the four biggest states where immigrants are concentrated, New York, California, Texas -- Trump did extremely well.60% : Our best guess is that immigrants went from being a Biden plus-27 group in 2020 to a group that Trump narrowly won in 2024.
54% : Trump won white men, white women, and non-white men among the very youngest voters in 2024.
49% : But over the next four years, people who didn't vote shifted from being a somewhat Democratic-leaning group to a group that Trump won by double digits...
48% : But if everyone had voted, Trump would have won the popular vote by nearly five points," Shor said.
48% : Trump narrowly won nonwhite men."
46% : Indeed, if all eligible voters had shown up and participated, Trump would have won the election by a greater margin: In 2020, according to [NYT] data, people who didn't vote would have been a little bit more Democratic than the country overall had they voted.
44% : (3) Trump won immigrants, another tectonic shift.
42% : But Trump even increased his vote share in Haitian precincts in Florida.
33% : In counties like Queens, N. Y., or Miami-Dade, Fla., Trump increased his vote share by 10 percentage points, which is just crazy...
30% : Klein followed up, asking, "so if you had forced them out to vote, they may have just voted for Donald Trump?"
29% : They thought that this was a last gasp of something and that if Donald Trump couldn't run up his numbers among seniors and you had millennials and Gen Z really coming into voting power, that would be the end of this Republican Party.
28% : Klein asked Shor about the theory among some Democrats that their voters stayed home, so the party didn't really lose to Trump, so much as they lost to 'the couch,' so to speak.
25% : Given how Democrats have spoken about immigration for years, and demonized Trump on that front, there's not much to be added to this: There's a very clear correlation between how many immigrants there were in a county and how much Trump's vote share increased.
9% : While the Democratic Party seems to be lost on a deranged wilderness journey at the moment, some of their leading data gurus are trying to piece together a reliable picture of why Donald Trump won and Kamala Harris lost.
*Our bias meter rating uses data science including sentiment analysis, machine learning and our proprietary algorithm for determining biases in news articles. Bias scores are on a scale of -100% to 100% with higher negative scores being more liberal and higher positive scores being more conservative, and 0% being neutral. The rating is an independent analysis and is not affiliated nor sponsored by the news source or any other organization.


 Townhall


